Collecting xEvents Query Stats From Multiple SQL Instances to a Central Database Part 2

In this post I will continue from the previous post about centralizing xEvents based query execution stats collection and reporting.   The key topics I will cover are:

1) Determine which sql instances you need to collect from and when the last collection return (to handle incremental loads throughout the day from the source servers to the central DB server)

2) Review of the xPath oriented queries that parse the .XEL files into a relational format for storage in the central DB

In my last post, I ended with discussing the XEL file’s offset functionality and how to use it within the sys.fn_xe_file_target_read_file system function to bring back a set of events “since the last poll”.  This functionality is what I use to perform incremental loads of xEvent query execution data from various remote sql servers into my central database.  First let’s take a look at the basic data model I am using:

xEventStorageTable

DB_ServerMain has the name of the SQL Server and a flag (enablexEventQuerCollection) to denote whether it should be included in centralized collection.  Straightforward enough… you can get the list of SQL instances to collect xEvents from with a query like:

Select *
from DB_ServerMain
where enablexEventQueryCollection = 1

Recall from my previous post, that we can use the file_offset value in the .XEL file to basically run an incremental load (return everything after the specified offset).  In the data model presented above, you can see the XEvents_Queries table has the servername, file_name, and file_offset value (along with the query stats specifics).  In order to fully automate the collection process, we need the name of the SQL Server instance, the name of the last XEL file collected from AND the highest file_offset value within that last file that we have a record of.

Select  a.ServerName,isnull(xEventFile.xEventFile_Name,'NULL') as xEventFile_Name, isnull(convert(varchar(50),xEventFileOffset.xEventFile_Offset), 'NULL') as xEventFile_Offset 
from DB_ServerMain a 
OUTER APPLY (Select max(file_name) as xEventFile_Name from dbo.XEvents_Queries ws where s.servername = a.servername ) as xEventFile 
OUTER APPLY (Select max(file_offset) as xEventFile_Offset from dbo.XEvents_Queries ws where ws.servername = a.servername and ws.file_name = (Select max(file_name) as xEventFile_Name from dbo.XEvents_Queries ws where ws.servername = a.servername )) as xEventFileOffset

I’ll admit, it’s not the slickest code in the world, but it works to pull the servername, filename and file_offset for each instance to be monitored.  The OUTER APPLY(s) help in keeping it fast enough even after you have millions of rows in xEvent_Queries.    Once you know the instances you want to collect from (and the latest filename/fileoffset combination), you can connect to each SQL instance and select the contents of the .XEL files using the additional parameters in the call to sys.fn_xe_file_target_read_file() system function like this:

SELECT CAST(event_data AS XML) AS event_data_XML, file_name, file_offset INTO #Events FROM sys.fn_xe_file_target_read_file('C:\DBAMonitoring\traces\sql2012*.xel', null,'C:\DBAMonitoring\traces\sql2012_0_130295018340930000.xel', 141312) AS F

In the example above, the call will create (and fill) a temporary table called #Events with the alerttime and full event XML for all files that match the wildcard search “c:\DBAMonitoring\traces\sql2012*.xel”.  It will then start with the file and file_offset we specified (sql2012_0_130295018340930000.xel  and 141312) and disregard any earlier files or earlier entries within the file (based on the file_offset value).

The above query is basically the “incremental load” since the last poll, but it only pulls the raw XML event data (into an XML column) with the filename and file_offset associated with that event.  In order to make sense of the XML event, it needs to be parsed using xPath functions to pull out the individual elements (e.g. reads, writes, duration, etc).  The code below shows that logic:

 SELECT @@ServerName as ServerName, 
 file_name,
 file_offset,
 event_data_XML.value ('(/event/action[@name=''query_hash'']/value)[1]', 'nvarchar(100)') AS query_hash, 
 DATEADD(mi, DATEDIFF(mi, GETUTCDATE(), GETDATE()), event_data_XML.value ('(/event/@timestamp)[1]', 'datetime' )) AS timestamp, 
 event_data_XML.value ('(/event/@name)[1]', 'vARCHAR(50)' ) AS EventName, 
 event_data_XML.value ('(/event/data [@name=''duration'' ]/value)[1]', 'int')/1000 AS duration_ms, 
 event_data_XML.value ('(/event/data [@name=''object_type'' ]/text)[1]', 'varchar(100)') AS object_type, 
 DB_Name(event_data_XML.value ('(/event/action [@name=''database_id'' ]/value)[1]', 'int')) AS DatabaseName, 
 CASE event_data_XML.value ('(/event/@name)[1]', 'vARCHAR(50)' ) 
 when 'sp_statement_completed' then event_data_XML.value ('(/event/data [@name=''object_name'' ]/value)[1]', 'NVARCHAR(4000)') 
 ELSE OBJECT_NAME(event_data_XML.value ('(/event/data [@name=''object_id'' ]/value)[1]', 'BIGINT'),event_data_XML.value ('(/event/action [@name=''database_id'' ]/value)[1]', 'int')) END as ObjectName, 
event_data_XML.value ('(/event/action [@name=''client_hostname'']/value)[1]', 'varchar(100)') as HostMachine, 
event_data_XML.value ('(/event/action [@name=''client_app_name'']/value)[1]', 'varchar(100)' ) as client_app_name, 
 event_data_XML.value ('(/event/action [@name=''nt_username'']/value)[1]', 'varchar(100)') as nt_username, 
 event_data_XML.value ('(/event/data [@name=''cpu_time'']/value)[1]', 'int')/1000 AS cpu_time_ms, 
 event_data_XML.value ('(/event/data [@name=''physical_reads'']/value)[1]', 'BIGINT') AS physical_reads, 
 event_data_XML.value ('(/event/data [@name=''logical_reads'' ]/value)[1]', 'BIGINT') AS logical_reads, 
 event_data_XML.value ('(/event/data [@name=''writes'' ]/value)[1]', 'BIGINT' ) AS writes, 
 event_data_XML.value ('(/event/data [@name=''row_count'' ]/value)[1]', 'BIGINT' ) AS row_count,
 CASE event_data_XML.value ('(/event/@name)[1]', 'vARCHAR(50)' ) 
 when 'sql_batch_completed' then event_data_XML.value ('(/event/data [@name=''batch_text'' ]/value)[1]', 'NVARCHAR(4000)') 
 ELSE event_data_XML.value ('(/event/data [@name=''statement'' ]/value)[1]', 'NVARCHAR(4000)') 
 END AS statement 
FROM #Events

The code above uses xPath to parse out the various elements of the XML event into usable tabular columns that match the order and structure of the xEvents_Queries table in the central database. The results look like this:

xpathresults

So now you have access to the reads/writes/cpu/durations as well as the statement within a larger batch or stored procedure that is using those resources.  You can run these type of queries on the host in question anytime to get a real-time look at the query activity, but pulling it all into a central database (with rows marked with an @@ServerName to delineate between instances) will be a more manageable solution for environments where there is more than one instance to keep an eye on (read: any environment)

With the information from this post and previous posts, you should be able to set up an active xEvents session to capture “statement complete” events.  You can then use the type of query similar to the above example to parse your captured xEvents data into easily consumable, aggregate-able (is that a word?) data sets for analysis.

I have used this type of setup on the local server to answer questions like this:

1) What are my top 5 executed tSQL statements on the server between 8:05AM and 10:30AM yesterday?

2) Which database had the most io/cpu usage for the last 6 hours?  Morning vs. Afternoon for the last 3 days? etc.

In my next post I’ll tie all of this together by going through a powershell ps1 file that has the above queries embedded into it and actually performs the write of query event rows from remote servers to the central database.

Collecting xEvents Query Stats From Multiple SQL Instances to a Central Database Part 1

In my previous post, I discussed setting up xEvents sessions in lieu of server side traces to collect statements level activity from a SQL Server instance.  I covered the basics of setting up the session to collect the sp_statement_complete and sql_statement_complete events to a .xel event file.  I also provided some queries that allow you to read the entries from all .xel files in directory and then parse the content into a regular tabular resultset for sorting, filtering, and aggregation.  While this is all very useful information to capture on a specific instance, most (if not all) of us in the DBA world are managing multiple SQL Server instances across production and non-production environments.  In this post I’ll cover the following topics:

1) Standardizing your xEvents sessions on individual sql instances to streamline the centralization process

2) Using powershell to automate the collection of xEvent data from multiple instances and store it in a set of centralized set of tables on one instance (a central management or monitoring sql server)

3) Automating an aggregation process to generate pre-aggregated table rows (by day, month, etc) for the query data we are collecting.

Standardize your Query Performance xEvents Sessions

In order to simplify the centralization of xEvent data, I adhered to the following simple configurations:

  1. All query performance xEvent sessions write out .xel file to the same named directory on any SQL instance.  In my case, I use c:\DBAMONITORING\traces for this.
  2. I configure the xEvent Session to write to 2MB files and rollover files after 40 have accumulated.  This ensures that I never have more that 80MB of disk space in use on  the local machine.  Later in the post, I’ll cover how I collect and centralize the data from the .xel files every 15 minutes so as long as you don’t product >80MB worth of .xel files every 15 minutes, you probably won’t lose captured event data between polls.
  3. All query performance xEvent .xel files should have the same prefix so they can be read into memory together.  In my case, all .xel files are started with SQL2012<somestring>.xel.

With these settings in place on each SQL 2012 instance that I want to collect xEvent query execution data from, I can use a powershell script executed on a central database instance that connects remotely to the monitored instances and pulls the recent xEvent data to a set of tables.

Centralized xEvent Processing and Collection

The diagram below illustrates the simple way that this solution works.

figure 1

The central database has a few tables to handle the following:

1) Control Table – has the names of the SQL instances that you would like to collect xEvent data from.  This list is used by the powershell script to determine which SQL instances to collect from each time that it runs.

2) xEvent Tables – These tables store the query performance information (xEvents) from the various servers in your environment.  Then you can run queries or write reports on top of this data to review instance specific query performance metrics.

The Powershell script performs the following actions:

1) Query the Control table to determine which instances to collect from.
2) Loop through the list of instances and for each one
a) connect and read the latest xEvent data from the .xel files on the server
b) Pre-process the data on the remote machine (in a temp table) and then load it directly into the xEvent tables in the central database

In my previous post (Capture and Review SQL 2012 Query Performance History with xEvents) I provided a TSQL script to run on a local instance that would read in the .xel files as XML strings to a temp table.  Then the second half of the query parsed the XML data into the familiar trace-like fields including:

Field Name Description
query_hash the unique query hash value that allows you to group identical calls without comparing/parsing the actual statement
timestamp time of the statement execution
EventName either sp_statement_completed or sql_statement_completed
duration_ms the duration in ms of the statement
object_type shows prepared or adhoc to indicate the type of call
DatabaseName the DB within which the statement was executed
ObjectName The name of the stored procedure called (if applicable)
cpu_time_ms total CPU ms used to complete the query
physical_reads physical read count required to complete the query
logical_reads logical read count required to complete the query
writes write count required to complete the query
row_count number of rows affected by the query
statement The actual statement that was executed

With those values above, you can run all kinds of grouping and time-windowed queries to see your most costly statements by cpu/reads/write/duration.  The only thing missing to centralize the content is to maintain an InstanceName with each record as well.  In the queries I make through the powershell script, I include an @@Servername as ServerName in the select list and few other control related fields including the .xel file name that the event came from and offset within the file that the event is part of.  Let’s take a quick step back and review how the .XEL files work in terms of logging xEvents to disk.

xEvents to Disk (.XEL file target), sys.fn_xe_file_target_read_file and Offsets

SQL Server provides a system function to read the data out of .xel files directly from TSQL.  The function is sys.fn_xe_file_target_read_file (documentation here: http://technet.microsoft.com/en-us/library/cc280743.aspx).  A basic call looks like this:

SELECT top 10000 file_name, file_offset, CAST(event_data AS XML) AS event_data_XML
FROM sys.fn_xe_file_target_read_file(‘C:\dbamonitoring\traces\sql2012*.xel’, null, null, null) AS F;

The above reads all of the files that start with “sql2012” and end with “.xel” in the directory and return a result set of events including the filename the event came from, the group offset number within the file (used for filtering) and an XML column of the full event data.  The results are shown below:

functionresults_offset

As you can see above, in an xel file, xEvents are logged in groups (denoted by a shared file_offset value).  When you call the  sys.fn_xe_file_target_read_file you can call it with a filename and a file_offset as parameters:

SELECT top 10000 file_name, file_offset, CAST(event_data AS XML) AS event_data_XML
FROM sys.fn_xe_file_target_read_file(‘C:\dbamonitoring\traces\sql2012*.xel’, null, ‘C:\dbamonitoring\traces\sql2012_0_130268187987170000.xel’, 775168) AS F;

In the example above, the select will return rows beginning with the specified file and file_offset and continue with rows from any subsequent files in the directory that match the sql2012*.xel search string.  Using this filtering functionality of the system function yielded better performance (in my limited tests) than comparing on an event timestamp which requires xpath-ing out the timestamp value and then a type conversion to make it a date for comparison.

part 2 coming soon….

Capture and Review SQL 2012 Query Performance History with xEvents

In this post, I’ll walk through the xEvents setup we have on a number of SQL 2012 instances. We use it to collect query performance metrics as a server-side trace replacement (note: this post assumes you are running SQL 2012+).  If you are familiar with server side tracing and/or profiler from 2008/2012, then a lot of this will make sense to you.  Basically I run an xEvent session that captures:

  • sp_statement_complete – individual statements within stored procedures that require more than 10 logical reads to complete
  • sql_statement_complete – individual statements within a sql batch (ad hoc) that require more than 10 logical reads to complete

We could just capture stored procedure completes and batch completes but going down to the statement level provides a few significant advantages (and challenges)

Advantages 

  • Statement level captures identify the specific sections within a larger stored procedure or batch which directs optimization efforts to the real slow elements.  If you capture events at the sp or batch completed level, then you’ll still need to do the work of finding the specific parts of the SP that are the slowest or most problematic.
  • In SQL 2012, sp and batch statement completed events include a query hash value so you can aggregate similar calls that use different parameters easily.  Back when we used server side traces to capture query execution information, i had to develop a complicated and resource intensive process that stripped raw sql calls of their parameter values and formatting so that they could then be aggregated for statistical analysis.

Disadvantages

  • Statement level captures will take in much more data than the sp/batch completed events, so you need to make sure you plan accordingly (more on this later…)
  • Since there is a much higher volume of data collected, it is harder to keep a long term, highly granular history.  (more on this below)

So the first step is to set up an xEvent session on the server in question.  I use this code:

CREATE EVENT SESSION [query_performance] ON SERVER
ADD EVENT sqlserver.sql_statement_completed(
ACTION(sqlserver.query_hash,sqlserver.client_hostname,sqlserver.database_id,
sqlserver.plan_handle, sqlserver.nt_username,
sqlserver.client_pid,
sqlserver.client_app_name)
WHERE (sqlserver.database_id >= 6 AND sqlserver.query_hash <> 0 )
),ADD EVENT sqlserver.sp_statement_completed(
ACTION(sqlserver.query_hash,sqlserver.client_hostname,sqlserver.database_id,
sqlserver.plan_handle, sqlserver.nt_username,
sqlserver.client_pid,
sqlserver.client_app_name)
WHERE sqlserver.database_id >= 6
AND sqlserver.query_hash <> 0)ADD TARGET package0.event_file(SET filename=N’C:\DBAMonitoring\traces\sql2012.xel’,
max_file_size=(2),
max_rollover_files=(40))
WITH (MAX_MEMORY=4096 KB,
EVENT_RETENTION_MODE=ALLOW_MULTIPLE_EVENT_LOSS,
MAX_DISPATCH_LATENCY=120 SECONDS,
MAX_EVENT_SIZE=0 KB,
MEMORY_PARTITION_MODE=NONE,
TRACK_CAUSALITY=OFF,
STARTUP_STATE=ON)

The code above creates an event session (names the events to capture and whatever filters we may have) but does not start the session. Some additional comments about the CREATE EVENT SESSION code above:

  • I capture sql_statement_completed and SP_statement_completed to capture SQL  statement level information (within ad hoc batches and stored procedures respectively).  My preference is to capture the lowest level query activity only (so I don’t have batchcompleted and spcompleted events cluttering the data set of individual sql statements.
  • You have the option to capture xEvents into the SQL Server Ring Buffer, but I have found the .xel files easier to deal with and allow for more fine grained control of retention.  As you see above, I am capturing xEvents to .xel files in the C:\DBAMonitoring\Traces folder on the sql instance in question.  I also limit files to 2MB each and no more than 40 files total (so a max disk footprint of 80Mb before older files are rolled over (aged out and deleted))
  • Since I am capturing query execution statistics for aggregations later, it is OK if I don’t collect every single event and I don’t want to collect events in a way that might impact performance so I set the EVENT_RETENTION_MODE=ALLOW_MULTIPLE_EVENT_LOSS setting on the event session.

Once you run the code above, the session is created on the SQL instance, but not started yet.  You can either run a start command in TSQL:

— start session
ALTER EVENT SESSION query_performance
ON SERVER
STATE = START;

or use SSMS to start the session

use SSMS to manage even sessions from within the Management folder of the instance

use SSMS to manage even sessions from within the Management folder of the instance

Once the xEvents Session is running you can see the .evt files collecting in the directory specified:

.evt files act just ilke the old .trc files ni that they reach a max size and then generate another file.  Once the rollover file count is met, then older files are deleted as new files are generated.

So just remember that the the “history” you can poll from active .evt files will be limited based on the volume of events captured and the sizing controls specified for the .evt file retention and rollover. You can query active .evt files much like you could with .trc files in SQL 2008 and 2005.  That said, I have found it easier to load the data into temp (or perm) tables from the evt files and then run additional queries for aggregations.

— copy event data into temp table #Events
— reads all .xel files that start with “sql2012” and end with “.xel” and puts each event into an XML column that we can query directly.
SELECT CAST(event_data AS XML) AS event_data_XML
INTO #Events
FROM sys.fn_xe_file_target_read_file(‘D:\DBAMonitoring\traces\sql2012*.xel’, null, null, null) AS F;

After the #Events table is populated, we can run the following XML xpath query to make ANOTHER temp table with the raw content separated out into individual columns.

— extract event details into a temp table #Queries
SELECT
event_data_XML.value (‘(/event/action[@name=”query_hash” ]/value)[1]’, ‘nvarchar(4000)’ ) AS query_hash,
event_data_XML.value (‘(/event/@timestamp)[1]’, ‘datetime’ ) AS timestamp,
event_data_XML.value (‘(/event/@name)[1]’, ‘vARCHAR(50)’ ) AS EventName,
event_data_XML.value (‘(/event/data [@name=”duration” ]/value)[1]’, ‘int’ )/1000 AS duration_ms,
event_data_XML.value (‘(/event/data [@name=”object_type” ]/text)[1]’, ‘varchar(100)’ ) AS object_type,
DB_Name(event_data_XML.value (‘(/event/action [@name=”database_id” ]/value)[1]’, ‘int’ )) AS DatabaseName,
CASE event_data_XML.value (‘(/event/data [@name=”object_type” ]/text)[1]’, ‘varchar(100)’ )
when ‘PROC’ then OBJECT_NAME(event_data_XML.value (‘(/event/data [@name=”object_id” ]/value)[1]’, ‘BIGINT’))
END as ObjectName,
event_data_XML.value (‘(/event/data [@name=”cpu_time” ]/value)[1]’, ‘int’ )/1000 AS cpu_time_ms,
event_data_XML.value (‘(/event/data [@name=”physical_reads”]/value)[1]’, ‘BIGINT’ ) AS physical_reads,
event_data_XML.value (‘(/event/data [@name=”logical_reads” ]/value)[1]’, ‘BIGINT’ ) AS logical_reads,
event_data_XML.value (‘(/event/data [@name=”writes” ]/value)[1]’, ‘BIGINT’ ) AS writes,
event_data_XML.value (‘(/event/data [@name=”row_count” ]/value)[1]’, ‘BIGINT’ ) AS row_count,
event_data_XML.value (‘(/event/data [@name=”statement” ]/value)[1]’, ‘NVARCHAR(MAX)’) AS statement
INTO #Queries
FROM #Events

With the raw data now in tablular format (#Queries) you can run any number of aggregations based on the query_hash field.  The query_hash is a unique identifier for similar queries that run with different parameters.  It is a huge time saver compared to the old server side trace approach where you had to write your own “generecize the sql statement so I can group on it” functionality.

So with the #queries table in place, you can run the query below to return the specific statements (by query _hash) ordered by total logical reads:

— filter and include a sample query
WITH QueryHashTotals AS
(
SELECT query_hash,DatabaseName, ObjectName,EventName,
COUNT(*) AS num_queries,
SUM(logical_reads) AS sum_logical_reads
FROM #Queries
GROUP BY query_hash,DatabaseName, ObjectName,EventName
),
RunningTotals AS
(
SELECT query_hash,DatabaseName, ObjectName, EventName,num_queries, sum_logical_reads,
CAST(100. * sum_logical_reads
/ SUM(sum_logical_reads) OVER()
AS NUMERIC(5, 2)) AS pct,
CAST(100. * SUM(sum_logical_reads) OVER(ORDER BY sum_logical_reads DESC
ROWS UNBOUNDED PRECEDING)
/ SUM(sum_logical_reads) OVER()
AS NUMERIC(5, 2)) AS running_pct
FROM QueryHashTotals
)
SELECT RT.*, (SELECT TOP (1) statement
FROM #Queries AS Q
WHERE Q.query_hash = RT.query_hash) AS sample_statement
FROM RunningTotals AS RT
ORDER BY sum_logical_reads DESC;

With the data in tables you can pretty much do whatever your want with it in terms of aggregations and queries.  Only simple modifications to the query are required to return results by writes, duration, cpu, etc.  In addition to the aggregations you can derive (Top N Queries), you can also use the raw data for investigations (“What was the query stream leading up to my database issue”).  It all depends on how much data you can retain and at what level of granularity.

My next post will discuss how to roll out this xEvents based query monitoring solution to multiple machines and collect the data to centralized database for reporting across an entire environment of SQL Server 2012 instance.  In the meantime, if you have any questions or issues with the samples above, email me or comment and I’ll try to reply as soon as  can.

Call a Powershell PS1 File from a Stored Procedure

Last week I was working on a project to help us better identify over 600 databases we have in production.  The final solution wound up including the following components:

  • Store various contact people and internal information on the databases themselves as Extended Properties.  We are tagging all of our production databases with a business owner, system owner, and development lead, as well as information describing the application(s) that the database supports.  While extended properties are a rarely used functionality within SQL Server, they are a good fit for our purposes:
    1. Extended properties travel with the database, so when we restore production databases to our development and testing SQL instances (either weekly or nightly in most cases) the non-production database copies will automatically have the same extended properties.  This is beneficial for us because we only have to maintain the content on the production databases and the information will automatically “trickle down” to the non-production environments with our existing restore processes.
    2. Extended properties are simple, expandable and native to SQL Server.  Extended Properties are implemented as simple name/value pairs so they are extremely flexible.  We will easily be able to alter the types and number of tags we want to assign to the databases without extensive development efforts.  You can also view the DB extended properties by right clicking on any database in SSMS which is a nice to have for DBAs and SysAdmin troubleshooting issues either on the machine itself or with remote access via SSMS.
    3. Extended properties are backwards compatible to SQL 2005.  We still have a handful of SQL 2005 instances and a few dozen SQL 2008 instances in our environment, so we wanted a mechanism that would work the same for everything we are running today.
  • Establish a centralized dataset of the database properties to support a Reporting Services report that is current and usable by application support and other less technical or privileged teams (no SSMS access is most cases).  We often make database server performance information available to non-DBA team members with custom SSRS reports that render various monitoring data (session activity, wait stats, etc).  A report that allows users to review the internal contact people and applications associated with specific databases is very useful for our application support team to determine who to contact if there are issues or questions.

In the initial phase of this effort, we were provided a spreadsheet that was exported from our disaster recovery planning system with the application name, system owner, business owner, and lead developer.  This information didn’t include a direct link to individual databases, so we went through and updated the spreadsheet with servernames (instances) and DB names.  We then developed a powershell script to go through the spreadsheet, connect to the various remote servers and assign DB level extended properties to the database in question.  This was great for our initial effort, but as you might imagine, there were several applications that we couldn’t map directly to a database and we needed to work with various business users to identify the appropriate app/db mappings.  We got the initial dataset done and propagated out to the various databases, but we needed a simple mechanism to allow users to assign an app/app owners set to a database easily from a web based front end.

In the end, we decided to provide a stored procedure on our central monitoring database instance that would take application/owner information as parameters and add the database level extended properties on the remote servers automatically.  Since we already had a decent set of working code to do this in powershell (from the initial import), we decided to implement the procedure by having it call a powershell ps1 script with parameters to shell out from the SQL stored procedure by using sp_executesql.

The powershell file is attached at the end of this post for reference, but here is the syntax for calling the PS1 script file with arguments(parameters) from within a SQL stored procedure.

create procedure [dbo].[set_DatabaseProperties]
(@ServerName varchar(100) = NULL,
 @DatabaseName varchar(100) = NULL,
 @App varchar(500) = 'UNKNOWN',
 @AppDesc varchar(500) = 'UNKNOWN',
 @ApprovalUser varchar(500) = 'UNKNOWN',
 @BusinessFunction varchar(500) = 'UNKNOWN',
 @BusinessOwner varchar(500) = 'UNKNOWN',
 @Dept varchar(500) = 'UNKNOWN',
 @LeadDeveloper varchar(500) = 'UNKNOWN',
 @ManagedBy varchar(500) = 'UNKNOWN',
 @SystemOwner varchar(500) = 'UNKNOWN',
 @Type varchar(500) = 'UNKNOWN'
 )
/************************************************************************************
**
** 07/25/13 MRaftree Initial Creation
**
*/
AS
BEGIN

 DECLARE @CmdExecStr varchar(5000)
if (@ServerName is not null and @DatabaseName is not null and @App <> 'UNKNOWN')
 BEGIN

-- build a command line string to execute the PS1 file with each argument in double quotes and separated by a space  Also, check the location of the powershell.exe file
--on your database server itself and make sure the path below is right
 Select @CmdExecStr = 'C:\WINDOWS\system32\WindowsPowerShell\v1.0\powershell.exe -File "C:\Powershell\SetDBProperties.ps1" "' + isnull(@ServerName,'Unknown') +'" "' + isnull(@DatabaseName,'Unknown') +'" "' + @App +'" "' + @AppDesc +'" "' + @ApprovalUser +'" "' + @BusinessFunction+'" "' + @BusinessOwner +'" "' + ISNULL(@Dept,'Unknown') +'" "' + @LeadDeveloper +'" "' + @ManagedBy +'" "' + @SystemOwner +'" "' + ISNULL(@Type,'Unknown') +'" '

 print @CmdExecStr
create table #returncode (value varchar(1000))
insert into #returncode exec master..xp_cmdshell @CMDExecStr
select * from #ReturnCode
 END
END

Here is the ps1 file itself for reference:  SetDBProperties.ps1

Linked Servers and Table Valued UDFs

I recently had an issue where a user wanted to call a user defined function on a remote machine via a linked server call.  Sounds logical right?  The problem is that there is an issue with SQL Server linked server that prevents User Defined Functions from being called via linked servers with the standard 4 part naming convention.

For example,  on SQLServerA I have a linked server to SQLServerB and there is a database on SQLServerB called Inventory that has a table valued user defined function called dbo.GetCurrentInventoryLevel(@productcategory int)

On SQLServerB I can just call the UDF normallyn from the Inventory database with something like:

Select * from dbo.GetCurrentInventoryLevel(3) 

The code above returns a resultset of current inventory levels for a series of products within a certain product category.  The problem is when you try to call that same function from SQLServerA via a linked server call.  You would assume this would work fine from SQLServerA (with a linked server in place to SQLServerB):

Select * from SQLServerB.Inventory.dbo.GetCurrentInventoryLevel(3) 

The problem is that this throws the error:

Msg 4122, Level 16, State 1, Line 1
Remote table-valued function calls are not allowed.

As it turns out, this is a known issue with SQL Server and there are no plans to resolve it in the next (2014) version.  There is an MS Connect page open for this issue that indicates that this won’t be fixed and presents some workarounds for the current SQL Server versions.

http://connect.microsoft.com/SQLServer/feedback/details/276758/remote-table-valued-function-calls-are-not-allowed

Basically, you can still call the Table Valued UDF over the linked server, but you can’t do it with the 4 part naming syntax.  You have to use OPENQUERY like this:

select * from OPENQUERY([SQLServerB], ‘Select * from Inventory.dbo.GetCurrentInventoryLevel(3) ‘) as CurrentInventoryTable

Hope this saves folks some time.

Wait Stats Report – Visualize Raw WaitStats Data

This post should close the loop on my last few Wait Stats monitoring posts.  In order to more easily sift through and make sense of raw wait stat information, I put together an SSRS report that connects to the DBAMonitoring database we’ve been populating and provides a clickable, visual display of wait stats per server.

Installing and configuring an SSRS setup is beyond the scope of this post, so I am going to assume that:

  1. You have access to a basic SQL Server 2008 SSRS instance that is running and you can get to via http://localhost/reports (or whatever your SSRS base URL is).
  2. You have configured the tables, procedures, powershell scripts and SQL Agent jobs from my previous posts on wait stats collection
  3. Download these two files
    • Wait_Stats.rdl (rename to .rdl)
    • rpt_FetchWaitStatsDiff.sql (rename to .sql) – this is the code for a stored procedure in the DBAMonitoring database that is used by the report when rendering wait stats across collection intervals.

In this post, I plan to cover the following:

  1. Deploying the report file (wait_stats.rdl) to your SSRS instance and stored procedure code to your
  2. Configuring a data source for the report
  3. Reviewing the queries that feed into the various visual components of the report

Assuming your localhost database has a DBAMonitoring database with all the tables and procedures from this and previous posts, you can simply upload the .rdl report file to your running SSRS instance from the web interface. Go to the SSRS url (e.g. http://localhost/Reports/Pages/Folder.aspx) and then click the “Upload File” button in the toolbar.  Select the rdl file from your local hard drive and click OK:upload2

Once the report is uploaded you should be able to run it from the SSRS web portal by simply clicking it.  if everything works properly, you should be able to open up the report right away and see a list of servers you have been collecting wait stat data from:

waitstatsserverlist

You can click on one of the sql instances (in my example, localhost and mraftree-bos-v are the same machine, but I can collect them separately to give the illusion of multi-server centralized management).  Once you click a sql server instance in the list, the report will refresh with the wait stat content:

fullwiatstats

Sections of the report:

1) Top Section – Wait Stats High Level Stacked Bar Chart – shows the interval specific wait stats on the 30 minute collection interval.  By default, this view shows the last 3 hours of collections.  You can easily see in this chart if there is a specific wait category that has spiked in a specific interval (indicating some issue with a poor query plan, paralellized workload, etc.)

2) Wait Stats Detail – shows the numeric representation of the wait stats for the last 30 minute interval.  This is a good place to look for the highest wait types and potentially drill in to determine a lower level reason for waits

3) Wait Group History Matrix – a numeric representation of the top level stacked bar chart.  It shows the specific wait category numbers by interval

4) Wait Type History – similar to the Wait Group Category Matrix, but shows the lower level wait type level stats.

Let me know if you have any issues deploying this report and the supporting code and I’ll be glad to help.

In my next post, I’ll be building on this central monitoring paradigm to capture and report on active session activity (running and inactive SPIDs and their associated SQL calls).  Happy Monitoring!

Wait Stats – Making Sense of Raw Data Collection

A lot of the work that went into this wait stats collection and reporting solution was inspired by the functionality of the MS SQL Server PerfDashboard reports. You can download the latest version here.  The PerfDashboard reports are great.  They provide good diagnostic information, they are accessible from within management studio and they look good.  The major limitation of these reports is that they do no offer a view into wait stats history at regular intervals.  At any point in time when you look at the perfdashboard reports, for wait stats you are just seeing the cumulative wait stats since the SQL Server instance started.  In most cases a SQL instance stays up for days/weeks/years and it becomes impossible to discern recent changes in wait stat activity due to the long time frame that the DMV’s wait stats have been accumulating.  For example, you may be having an issue in the last 6 hours with queries running inefficiently due to parallelism, but you may not be able to see a lot of parallelism waits (CX_PACKET wait type) relative to other types of waits that have been accumulating for months.

This is what the “Historical Waits” perfdashboard report shows:

Historical Waits (PerfDashboard)

It looks nice, but if the above wait stat information is based on a server running for the last 180 days, it’s not much use in terms of debugging a recent issue with SQL Server performance.  You may have had a serious CPU issue eariler in the day, but even a significant event for 45 minutes wouldn’t skew the “CPU” wait type’s overall value or percentage position in the list above.  It just wouldn’t have enough impact to “show through” against the larger time frame that all the stats are collected within cumulatively.

The collection approach I covered in my last post is the first step toward discerning recent wait statistics without restarting the instance.  The collection approach is admittedly simple (just collect the accumulated wait stats per server every 30 minutes).  But once you have a reasonable set of snapshots (a few hours’ worth), you can run calculations across collections to see the “real” wait stats by wait type on a 30 minute interval basis.  Before I get into the logic required to calculate the diffs across collections, take a look at the SSRS report I put together based on DB_WaitStats table data.

waitstatssrs

Notice that information is displayed in 30 minute increments (since the job is collecting a snapshot of wait stat data every 30 minutes from SQL Agent).  The top section shows a stacked bar chart with each 30 minute collection’s wait category data (so you can easily see if any one wait category – color in the graph – is growing or shrinking significantly).

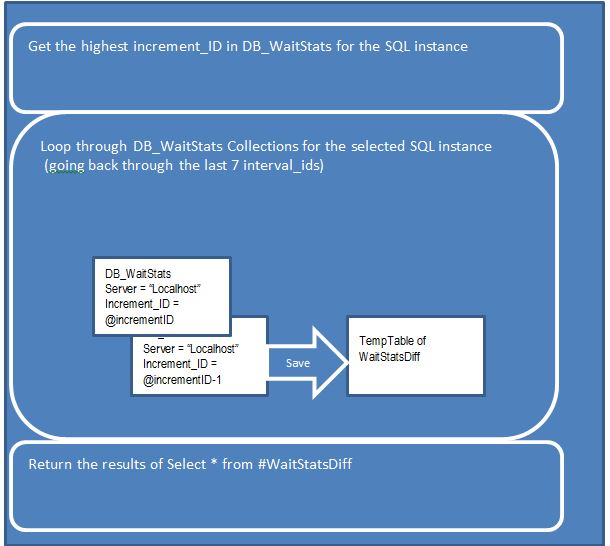
The tabular matrix below it is showing the same data as the graph, but in numerical format with each column representing a different collection interval.  The same query (within a stored procedure) is used for both the stacked bar chart and the numerical matrix.  The high level control of flow in the procedure is depicted in the image below:

waitstatsproc

  1. Before the loop, get the latest increment_id for the server in question (so we can use it as a starting point to go back in time across collection intervals)
  2. Within the loop – compare the cumulative collected wait stats between the current interval_id and previous interval_id (to determine the “real” wait time between collections).  For each iteration, insert rows into a temp table with the “real” wait times for the server/interval combination.
  3. Return the results from the temp table.

The procedure could probably be altered to do a recursive CTE to accomplish the same thing, but looping through increment_id’s for a particular server seemed more logically consumable and understandable.  You can download the code for the procedure here: rpt_FetchWaitStatsDiff.sql  (rename to .sql from the .key file extension).  I also leverage a great table create (and populate) script from Jason Strate (http://www.jasonstrate.com/2010/01/wait-stat-categories/) to generate a table called WaitTypeCategory that I use to join wait_types together in order to provide a higher level aggregate of wait types.  That script can be downloaded here: WaitTypeCategory.sql

So now we have the collection powershell script and the sql agent job to force the collection of SQL Instance wait stats every 30 minutes to the central DBAMonitoring database.  In addition to that, we have the rpt_FetchWaitStatsDiff procedure that will calculate the intra-collection “real” wait stats and return them for the last 6 intervals.

In my next post, I’ll go through the SSRS report I showed above in detail to show you how to visualize this data and enable yourself to quickly diagnose high level wait-oriented issues with your SQL instances.

Baby Steps 2 – Central Collection of WaitStats

The next step in the process will be to build upon my earlier post (“Baby Steps”) by expanding the components in the following ways:

  1. Add a new table called DB_WaitStats to the DBAMonitoring database (structure detailed below)
  2. Build on the existing powershell script to loop through our SQL instances, run a WaitStats oriented DMV query and save the results to the DBAMonitoring..DB_WaitStats table.
  3. Schedule the powershell script to run every 30 minutes in SQL Server Agent.

This post will discuss the collection and storage mechanisms of the solution and my next post will cover an SSRS report that allows you to easily visualize this data (per server) to assist in troubleshooting and debugging.

DB_WaitStats Table to Persist Wait Stat Collections

The following is a table definition to store a fairly standard set of Wait Stat information from DMV calls:

CREATE TABLE [dbo].[DB_WaitStats](
[wait_type] [nvarchar](60) NOT NULL,
[waiting_tasks_count] [bigint] NOT NULL,
[wait_time_ms] [bigint] NOT NULL,
[max_wait_time_ms] [bigint] NOT NULL,
[signal_wait_time_ms] [bigint] NOT NULL,
[ServerName] [varchar](128) NOT NULL,
[capture_time] [datetime] NOT NULL,
[increment_id] [int] NOT NULL
) ON [PRIMARY]

GO

CREATE CLUSTERED INDEX [CI_WaitStats_ServerName] ON [dbo].[DB_WaitStats]
(
[capture_time] ASC,
[ServerName] ASC,
[increment_id] ASC
)WITH (PAD_INDEX = OFF, STATISTICS_NORECOMPUTE = OFF, SORT_IN_TEMPDB = OFF, DROP_EXISTING = OFF, ONLINE = OFF, ALLOW_ROW_LOCKS = ON, ALLOW_PAGE_LOCKS = ON, FILLFACTOR = 90) ON [PRIMARY]
GO
So it is just a basic table with a clustered index on capturetime/servername/increment_id (more on this later).

Also create a simple table to hold the wait types that we want to ignore (there may be cases where certain wait stats can be disregarded when reviewing the data later):
CREATE TABLE [dbo].[DB_ignorewaits](
[wait_type] [varchar](250) NULL
) ON [PRIMARY]

With that in place, it is time to revisit the powershell script from my previous post.  Two key areas of the script are enhanced in this iteration including a smarter loop of the servers to collect from as well as the logic to execute the DMV query on the remote server and save the results to the local DBAMonitoring..DB_WaitStats table.

Note On The Cumulative nature of WaitStats DMVs

The queries we will be using to collect wait stats use the sys.dm_os_wait_stats DMV.  This DMV maintains cumulative wait stats by type since the last time the  sql instance was started.  In order to more effective (and easily) determine the actual wait stats between collection intervals (every 30 minutes in our case), the DB_WaitStats table has a increment_id int column that stores an integer value that is one greater than the last collection’s interval_id for the same server.  In a later post I will show you how to use this field to perform some comparisons across collections to get the real “wait stats for the last 30 minutes”

PowerShellCollectWaitStats.ps1 Script

The code below is for setting up the foreach loop to got through each SQL instance we want to collect from, connecting to it and running the DMV query to gather information.  It has a few additional elements than my original script;

  1. The $query variable that selects from DBAMonitoring..DB_ServerMain has been updated with a left join to DB_WaitStats so that we can pull back each SQL instance name AND the highest increment_id value we have for previous wait stat collections on a given SQL instance.
  2. I also declare a new SQL Server connection variable ($SourceConnection) that will be used within the loop to connect directly to each monitored sql instance and execute the wait stats DMV query
#—- BEGIN CODE —
try
{# create a connection string to connect to the DBAMonitoring Instance and Database
$ServerAConnectionString = “Data Source=localhost;Initial Catalog=DBAMonitoring;Integrated Security=SSPI;”
$ServerAConnection = new-object system.data.SqlClient.SqlConnection($ServerAConnectionString);#Create a Dataset to hold the DataTable from the DB_ServerMain table
# we will loop through this recordset next
$dataSet = new-object “System.Data.DataSet” “DBServers”$query = “SET NOCOUNT ON;”
$query = $query + “Select a.DBServerID, a.ServerName, max(isnull(b.increment_id,0))+1 as increment_id ”
$query = $query + “from DB_ServerMain a ”
$query = $query + “left outer join DB_WaitStats b ”
$query = $query + “on a.ServerName = b.ServerName ”
$query = $query + “group by a.DBServerID,a.ServerName “#Create a DataAdapter which we will use to populate a data set (like a recordset)
$dataAdapter = new-object “System.Data.SqlClient.SqlDataAdapter” ($query, $ServerAConnection)
$dataAdapter.Fill($dataSet) | Out-Null#create a new connection object we will use to connect dynamically to each sqlinstance
$sourceConnection = New-Object System.Data.SqlClient.SQLConnection($SourceConnectionString)#the “$a” is one row from the resultset, and you can reference specific fields with $a.fieldname from within the loop
foreach($a in $dataSet.Tables[0].Rows)
{

Within the foreach loop (below), the updated script is performing a few new operations.  Each time through the loop (once for each SQL Instance) the code will:

  1. Set Variables
    • Set variables for source/target connection strings (to connect to the remote sql instance AND the central monitoring instance with the DBAMonitoring database)
    • Set the $sql variable which contains the select statement that will be executed against the remote instance (in our case against the sys.dm_os_wait_stats DMV)
  2. Connect to the remote instance and execute the DMV query
  3. Use the BulkCopy object to copy the results of the query from the remote sql instance to the central DBAMonitoring database

#the “$a” is one row from the resultset, and you can reference specific fields with $a.fieldname from within the loop
foreach($a in $dataSet.Tables[0].Rows)
{

# This is the area of code where “per server” queries can be executed and then saved back to the central database
write-host “DBServer: ” $a.ServerName ;
# open a connection for the server/database
$SourceConnectionString = “Data Source=”+$a.Servername+”;Integrated Security=SSPI;”
$DestinationConnectionString = “Data Source=localhost;Initial Catalog=DBAMonitoring;Integrated Security=True”

#the name of the target table we are going to insert into ni the DBAMonitoring database
$tableName = “DB_WaitStats”

#the wait stats query we will run aganist each sql instance in DBAMONITORING..DB_ServerMain
$sql = “DECLARE @DT DATETIME ; ”
$sql = $sql + “SET @DT = GETDATE() ; ”
$sql = $sql + “SELECT [wait_type], [waiting_tasks_count], [wait_time_ms], [max_wait_time_ms], ”
$sql = $sql + ” [signal_wait_time_ms], ‘” + $a.ServerName+ “‘ AS ServerName, @DT as capture_time, ” + $a.increment_id + ” as increment_id ”
$sql = $sql + “FROM sys.dm_os_wait_stats; ”
#write-host $sql
$sourceConnection.ConnectionString = $SourceConnectionString
$sourceConnection.open()
$commandSourceData = New-Object system.Data.SqlClient.SqlCommand($sql,$sourceConnection)
$commandSourceData .CommandTimeout = ‘300’

$reader = $commandSourceData.ExecuteReader()

$bulkCopy = new-object (“Data.SqlClient.SqlBulkCopy”) $DestinationConnectionString
$bulkCopy.DestinationTableName = $tableName
$bulkCopy.BatchSize = 5000
$bulkCopy.BulkCopyTimeout = 0
$bulkCopy.WriteToServer($reader)

$sourceConnection.close()

}

You can download the whole script powershellcollectwaitstats .ps1  (rename to .ps1 as the file extension)

Once you have the script in the PowerShell ISE, you can run it and should see a simple output in the console pane of each sql instance that was collected from:

waitstsrun

Confirm it is working properly by performing a “Select * from DB_WaitStats” in your DBAMonitoring database.  You should have a few hundred rows per SQL instance, per collection.

Once the powershell script is working from the ISE, create a SQL Agent Job to have it run every 30 minutes.  You can use this code to create the job on your SQL Server instance (rename to .sql WaitStatsSqlAgentJob.txt)

The job is a simple 2 step job:

waitstatsjobsteops

The first step deletes aging records out of the DBAMonitoring..DB_WaitStats table so it doesn’t grow uncontrollably.  The script is configured to delete collections older that 3 days, but you can easily alter this to fit your needs.

The second step calls the ps1 powershell script file using the Operating System (CmdExec) job step type.  You basically call the powershell environment and give it the path to your ps1 file as shown below:

waitstatsjobsteps2

The job is scheduled to run every 30 minutes to collect new snapshot of remote server wait stats and it will delete aging collections.  Run it manually a couple of times from sql agent to make sure it is executing properly

Meanwhile…. back in DBAMonitoring..DB_WaitStats

Now go back to your central instance and query the DB_WaitStats table.  You should see a few hundred rows per instance/per collection.  Don’t worry that in most cases, the majority of the wait types have 0 values.  For our purposes we collect everything so we can compare across collections to determine what is happening with all wait stats.  The data that is contained in the table is very raw (just wait type, the cumulative wait time and a server and time stamp).  In my next post I’ll cover a stored procedure that can refactor this raw data into the actual wait times by wait types across collection intervals (so you can easily see the biggest wait type(s) for the last 30 minutes or major changes in the wait profile over the course of a few hours).  I’ll also cover a basic SSRS report that can sit on top of the DB_waitStats table to provide a more easily interpreted view of the information.

Nested Views And Bad Plans – Not Pushing Predicates

I came across an issue in one of our production SQL Servers yesterday that had to do with nested views and sudden, terrible performance of once highly responsive queries.  First a little background….

Views on Top of Views

In one of our application databases, we have a complex view that is used to denormalize financial transaction information to make it easier for users to access all the various dates, amounts, and other identifying flags  in a single “selectable” object.  This view works well for our purposes and has been reliably quick to return results (we maintain the underlying indexes and statistics and have optimized the tSQL in the view to a reasonable level).

In an effort to extend this approach of giving users access to a simplified version of the underlying data through a view,  a second view was developed to provide users with aggregate data.  This second view  performs a select on the first view with several sum and count functions and a long group by list.  So we have a “nested view” scenario with fairly complicated query logic in each view.

View 1 – Denormalized Data
create view vwCustomerHoldings as
Select custid, acctid, fundID, fundName, code1, code2, price1, price2, price3, tradedate, effectivedate
From <~20 tables with various join conditions>
View 2 – Aggregates of the denormalized data
create view vwCustomerHoldingsAggregate as
Select custid, acctid, fundID, fundName, code1, code2, tradedate, effectivedate,sum(price1), sum(price2), sum(price3)
From vwCustomerHoldings
GROUP BY custid, acctid, fundID, fundName, code1, code2, tradedate, effectivedate

For months and months we had no issues with various users pulling data with queries like this:

Select *
from vwCustomerHoldings
Where effectivedate = ‘6/21/2013’
and code1 in (‘val1′,’val2′,’val3′,’val4′,’val5′,’val6′,’val7′,’val8′,’val9’)

The typical response time was 3-5 seconds which is well within acceptable bounds for this application.  Yesterday, execution duration jumped up to ~2 minutes for the same call.

We checked the statistics on the underlying tables first and they were fresh within the last 6 hours.  (I have a  stats age script I have been using for a long time from Glenn Berry that I got here.)  There were no index or underlying table structure changes and there hadn’t been a significant change to the underlying data (other than the usual overnight load of yesterday’s transactions).  So we started executing the query in management studio and looking at the IO stats and the query plans.  As you might imagine the query plans associated with calls like this are very large and difficult to dissect online, so I’m going to focus on the results of SET STATISTICS IO ON which were just as revealing of the issue.

First we ran the query against a dev system with a smaller data set, and got a good result (4 second response time).  The Statistics IO information is below:

It has a high read profile (~400K reads on average for the good plan), but that is OK in our environment. When we run the same query on the production data set, the statistics IO looks a LOT different and has a few key elements that reveal what is happening;

stats1

The first thing that stands out is the HUGE IO on the Worktable object (>100 Million Reads).  Obviously, SQL Server has chosen a less than optimal plan to execute the TSQL on our production instance.  My initial reaction is “How can there be so many reads with that Worktable? Its almost like it’s reading the entire underlying data set with no where clause at all….!??!”…

It turns out that is exactly what is happening.  This is an example of a failure of the query optimizer to pick an execution plan that applies the WHERE clause first (or at least earlier in the execution).  The result is that the entire data set from vwCustomerHoldings is being aggregated by vwCustomerHoldingsAggregate before the where effectivedate=’6/21/2013′ is applied to the underlying data set.  So that massive Worktable entry in the statistics IO is evidence that all of the data is being run without any where clauses being applied until the end. This is a failure to execute something call “Predicate Pushing” in the execution plan.  Ideally the predicates (where clause conditions) are applied as early in the execution as possible to lower the row count that needs to be worked on and joined to by the rest of the query.  SQL Server usually does this, but in some cases, like this one, it stopped doing it.

The other red flag in the output is that the bad plan has a:

Warning: Null value is eliminated by an aggregate or other SET operation.

The good plan doesn’t have this in the output.  This warning is issued whenever you perform aggregate functions on fields that have a null.  SQL Server disregards them so you don’t have a sum() getting voided by doing a “+ NULL”.  The fact that we see this on the bad plan and not the good is a further indication that the entire vwCustomerHoldingsAggregate view is being run (with all of it’s aggregates and group bys) BEFORE the where clause is applied.  In the good plan, the where clauses (effective date and code filters) are applied first (via predicate pushing) so that when the aggregate logic from the vwCustomerHoldingsAggregate view is finally executed, there aren’t any NULL values to eliminate so the message is not output.

There are a few approaches that we investigated to help eliminate this problem.

  • Use an Indexed View to materialize the columns and simplify the plan – This won’t work because you can’t have an indexed view that references another view (see here)
  • Convert the top level view (vwCustomerHoldingsAggregate) to a stored procedure – This would allow us a lot more flexibility in using query hints or even a plan guide to force a known good plan on calls to the procedure.
  • Don’t use the top level view, but instead re-write all the places of the application using the vwCustomerHoldingsAggregate view and replace them with inline SQL to perform the aggregates against the underlying view.

The last 2 options are not great for us because the application is using the vwCustomerHoldingsAggregate view in over 50 places and would be difficult to make such a sweeping change without a lot of development and testing effort.  While   the view is referenced in  many places by the application, it is only in a handful of places where we are seeing this bad query plan issue.

We tested a few different query hints and found that OPTION (Force Order) always results in the optimal execution plan for single day calls like the one in question (<5 seconds response time).  So in a couple of places in the application, we are having our developers tweak the sql to look like this:

Select *
from vwCustomerHoldings
Where effectivedate = ‘6/21/2013’
and code1 in (‘val1′,’val2′,’val3′,’val4′,’val5′,’val6′,’val7′,’val8′,’val9’)
OPTION (FORCE ORDER)

This query hint works in our case, because the underlying tables that our where clauses apply to are among the first few tables in the FROM clause of the vwCustomerHoldings lower level view.  Forcing the order in which the tables are joined and filtered in the execution plan has resulted in a consistent, good plan for our problem query so we have a stop gap in place to keep things performing within acceptable ranges.  However, this is not a good long term solution for us.  We will need to address areas where we have nested views and put in the effort to convert them to parameterized queries or stored procedures so that we can better control query plan generation in the future.

Here are a few links about this scenario as well:

http://stackoverflow.com/questions/7183198/does-sql-server-propagate-where-conditions-in-complex-views
http://jahaines.blogspot.com/2010/03/performance-tuning-101-what-you-will_17.html
http://stackoverflow.com/questions/6653979/why-does-putting-a-where-clause-outside-view-have-terrible-performance

Baby Steps – Central Monitoring Database

Central Database
The first thing to do is set up a dedicated central monitoring database (which I will refer to as “DBAMonitoring’ moving forward).  This database will be used to house things like:
1)      A central table of all SQL Server instances to monitor
2)      Various data tables to hold performance data collections
3)      Supporting lookup/translation tables (if necessary)
Once you make a new database called DBAMonitoring, create a table called DB_ServerMain;

CREATE TABLE [dbo].[DB_ServerMain](
[DBServerID] [smallint] IDENTITY(1,1) NOT NULL,
[ServerName] [varchar](128) NOT NULL,
[ServerDescr] [varchar](200) NULL,
[SessionCollectionInterval] [int] NULL,
CONSTRAINT [PK_DBServerID] PRIMARY KEY CLUSTERED
(
[ServerName] ASC
)WITH (PAD_INDEX  = OFF, STATISTICS_NORECOMPUTE  = OFF, IGNORE_DUP_KEY = OFF, ALLOW_ROW_LOCKS  = ON, ALLOW_PAGE_LOCKS  = ON, FILLFACTOR = 80) ON [PRIMARY]
) ON [PRIMARY

Next let’s add a few rows to the table for SQL instances that we want to monitor.

insert into [DB_ServerMain] (ServerName,ServerDescr,SessionCollectionInterval)Values (‘localhost’,’My local server’, 5)
insert into [DB_ServerMain] (ServerName,ServerDescr,SessionCollectionInterval)Values (‘SQLServer2′,’Test SQL Server Environment’, 5)

Now we have a basic table in place to keep a list of SQL Server instances we want to monitor and a couple of records that map to existing SQL Servers in our environment. We can start developing a powershell script template that can loop through all of the servers in the table (and eventually perform some action like capturing the results from DMV queries).  The basic powershell functions that I’ll describe next include:

1)      Connect to the DBAMonitoring Database and fetch a recordset of the SQL servers from DB_ServerMain.
2)      Loop through each server and for each

  1. Connect to the sql instance
  2. Run a dynamic query to collect some pertinent set of monitoring data
  3. Commit that data to a local table in the DBAMonitoring database (e.g. DB_WaitStats, DB_DBSpaceUsed, etc.)
My Thoughts on Powershell
When powershell first came out several years ago I was hesitant to embrace it.  It seemed like yet another language and framework to learn that didn’t offer me any game changing functionality (i.e. There weren’t too many things I couldn’t get done with some combination of tSQL scripts and VBScript .bat files).  That said, I have steadily built up what I call a “working capability” in powershell programming and have found it fairly straightforward.  Also, over the last few years the amount of data available online (message board posts, blogs, and even the MSDN help) has made it much simpler to cobble together working powershell scripts and get answers to issues that you encounter.  The powershell scripts I will be elaborating on in this series of posts were developed based on other fragments of scripts

Consider the powershell script code below.  It connects to my localhost SQL Server instance and my new DBAMintoring database using windows authentication (Integrated Security = SSPI) with a standard SQL connection string syntax:

$ServerAConnectionString = “Data Source=localhost;Initial Catalog=DBAMonitoring;Integrated Security=SSPI;”

These links have more information on SQL Server connection strings in powershell:
http://sqlnovice.blogspot.com/2009/08/sql-server-connection-string-format-for.html
http://www.connectionstrings.com/sql-server-2008

#—-   BEGIN  CODE   —try
{
# create a connection string to connect to the DBAMonitoring Instance and Database
$ServerAConnectionString = “Data Source=localhost;Initial Catalog=DBAMonitoring;Integrated Security=SSPI;”$ServerAConnection = new-object system.data.SqlClient.SqlConnection($ServerAConnectionString);#Create a Dataset to hold the DataTable from the DB_ServerMain table
# we will loop through this recordset next
$dataSet = new-object “System.Data.DataSet” “DBServers”
$query = “SET NOCOUNT ON;”
$query = $query + “Select * from DB_serverMain”
 #Create a DataAdapter which we will use to populate the a data set (like a recordset)
$dataAdapter = new-object “System.Data.SqlClient.SqlDataAdapter” ($query, $ServerAConnection)
$dataAdapter.Fill($dataSet) | Out-Null

#the “$a” is one row from the resultset, and you can reference specific fields with $a.fieldname from within the loop
foreach($a in $dataSet.Tables[0].Rows)
{
# This is the area of code where “per server” queries can be executed and then saved back to the central database
write-host “DBServer: ” $a.ServerName   ;
}
}
catch
{
# if there is an error in the powershell execution, catch it and return it to the screen
$ex = $_.Exception
Write-Host “Write-DataTable$($connectionName):$ex.Message
}
#—-   END CODE—

If you can, download and install powershell 3.0 (http://www.microsoft.com/en-us/download/details.aspx?id=34595).  It has a nice integrated scripting environment (ISE) that makes it easier to develop and run powershell scripts.  Start up the Powershell ISE (Start-> All Programs -> Accessories->Windows Powershell -> Windows Powershell ISE

Image

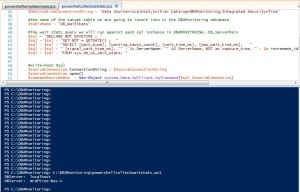
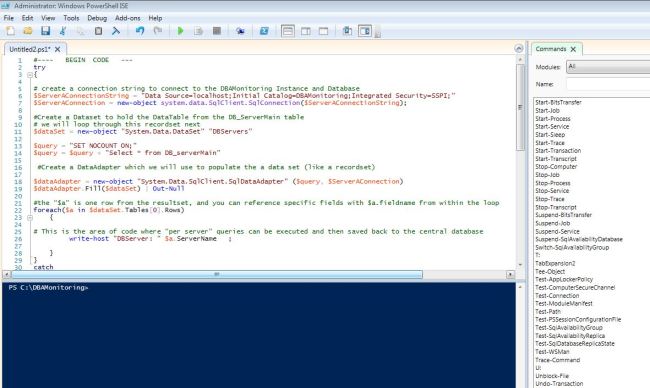
Paste the powershell code above into the code window of the ISE and then click the Run Script button (F5) to execute it.  You will see all of the code appear in the execution window at the bottom and the results:

ISEGrab2

As you can see above, the sample code simply opens a record set of SQL Server Names and loops them printing each to the console (powershell “write-host” calls).  Now save the code as a .ps1 powershell script file (just use the regular Save button in the ISE) and then run it (green triangle button).  Now the execution just runs the ps1 file instead of the all the code line by line in the console:

ISEGrab3

With the ps1 file it makes it a lot easier to schedule SQL Server Agent jobs to simply execute various poweshell scripts from a directory (instead of having LOTS of powershell code embedded in SQL Agent job steps).

Simple test case complete!  In my next post we’ll build on this powershell looping script to collect SQL Server Wait stats for troubleshooting purposes.